We analyzed 5 years’ worth of childcare prices. Here’s what we found.

Parents who have the feeling that child care gets more expensive every year aren’t imagining it. A new analysis of the Women’s Bureau’s National Database of Childcare Prices (NDCP) shows that between 2013 and 2018, across 37 states, prices rose in the majority of counties. High-population counties and counties with large Hispanic concentrations were most likely to experience price increases. This trend persisted across care for infants, toddlers, preschoolers and school-aged children.
While the cost of child care varies on a number of dimensions, it is typically untenable for families, sometimes costing almost one-fifth of a family’s annual income for just one child, which is more than the cost of rent across the 100 largest U.S. metro areas. Monthly childcare prices in 2018, adjusted to 2024 dollars, ranged from about $5,940 per school-age child in a home-based setting (8% of median family income) to $19,040 for infants in a center (19.3% of a family’s median income). Research suggests that some mothers forego employment due to the high cost of child care, which in turn has implications for both a family’s financial security and the health of the broader economy.
All types of child care saw price increases in the majority of counties
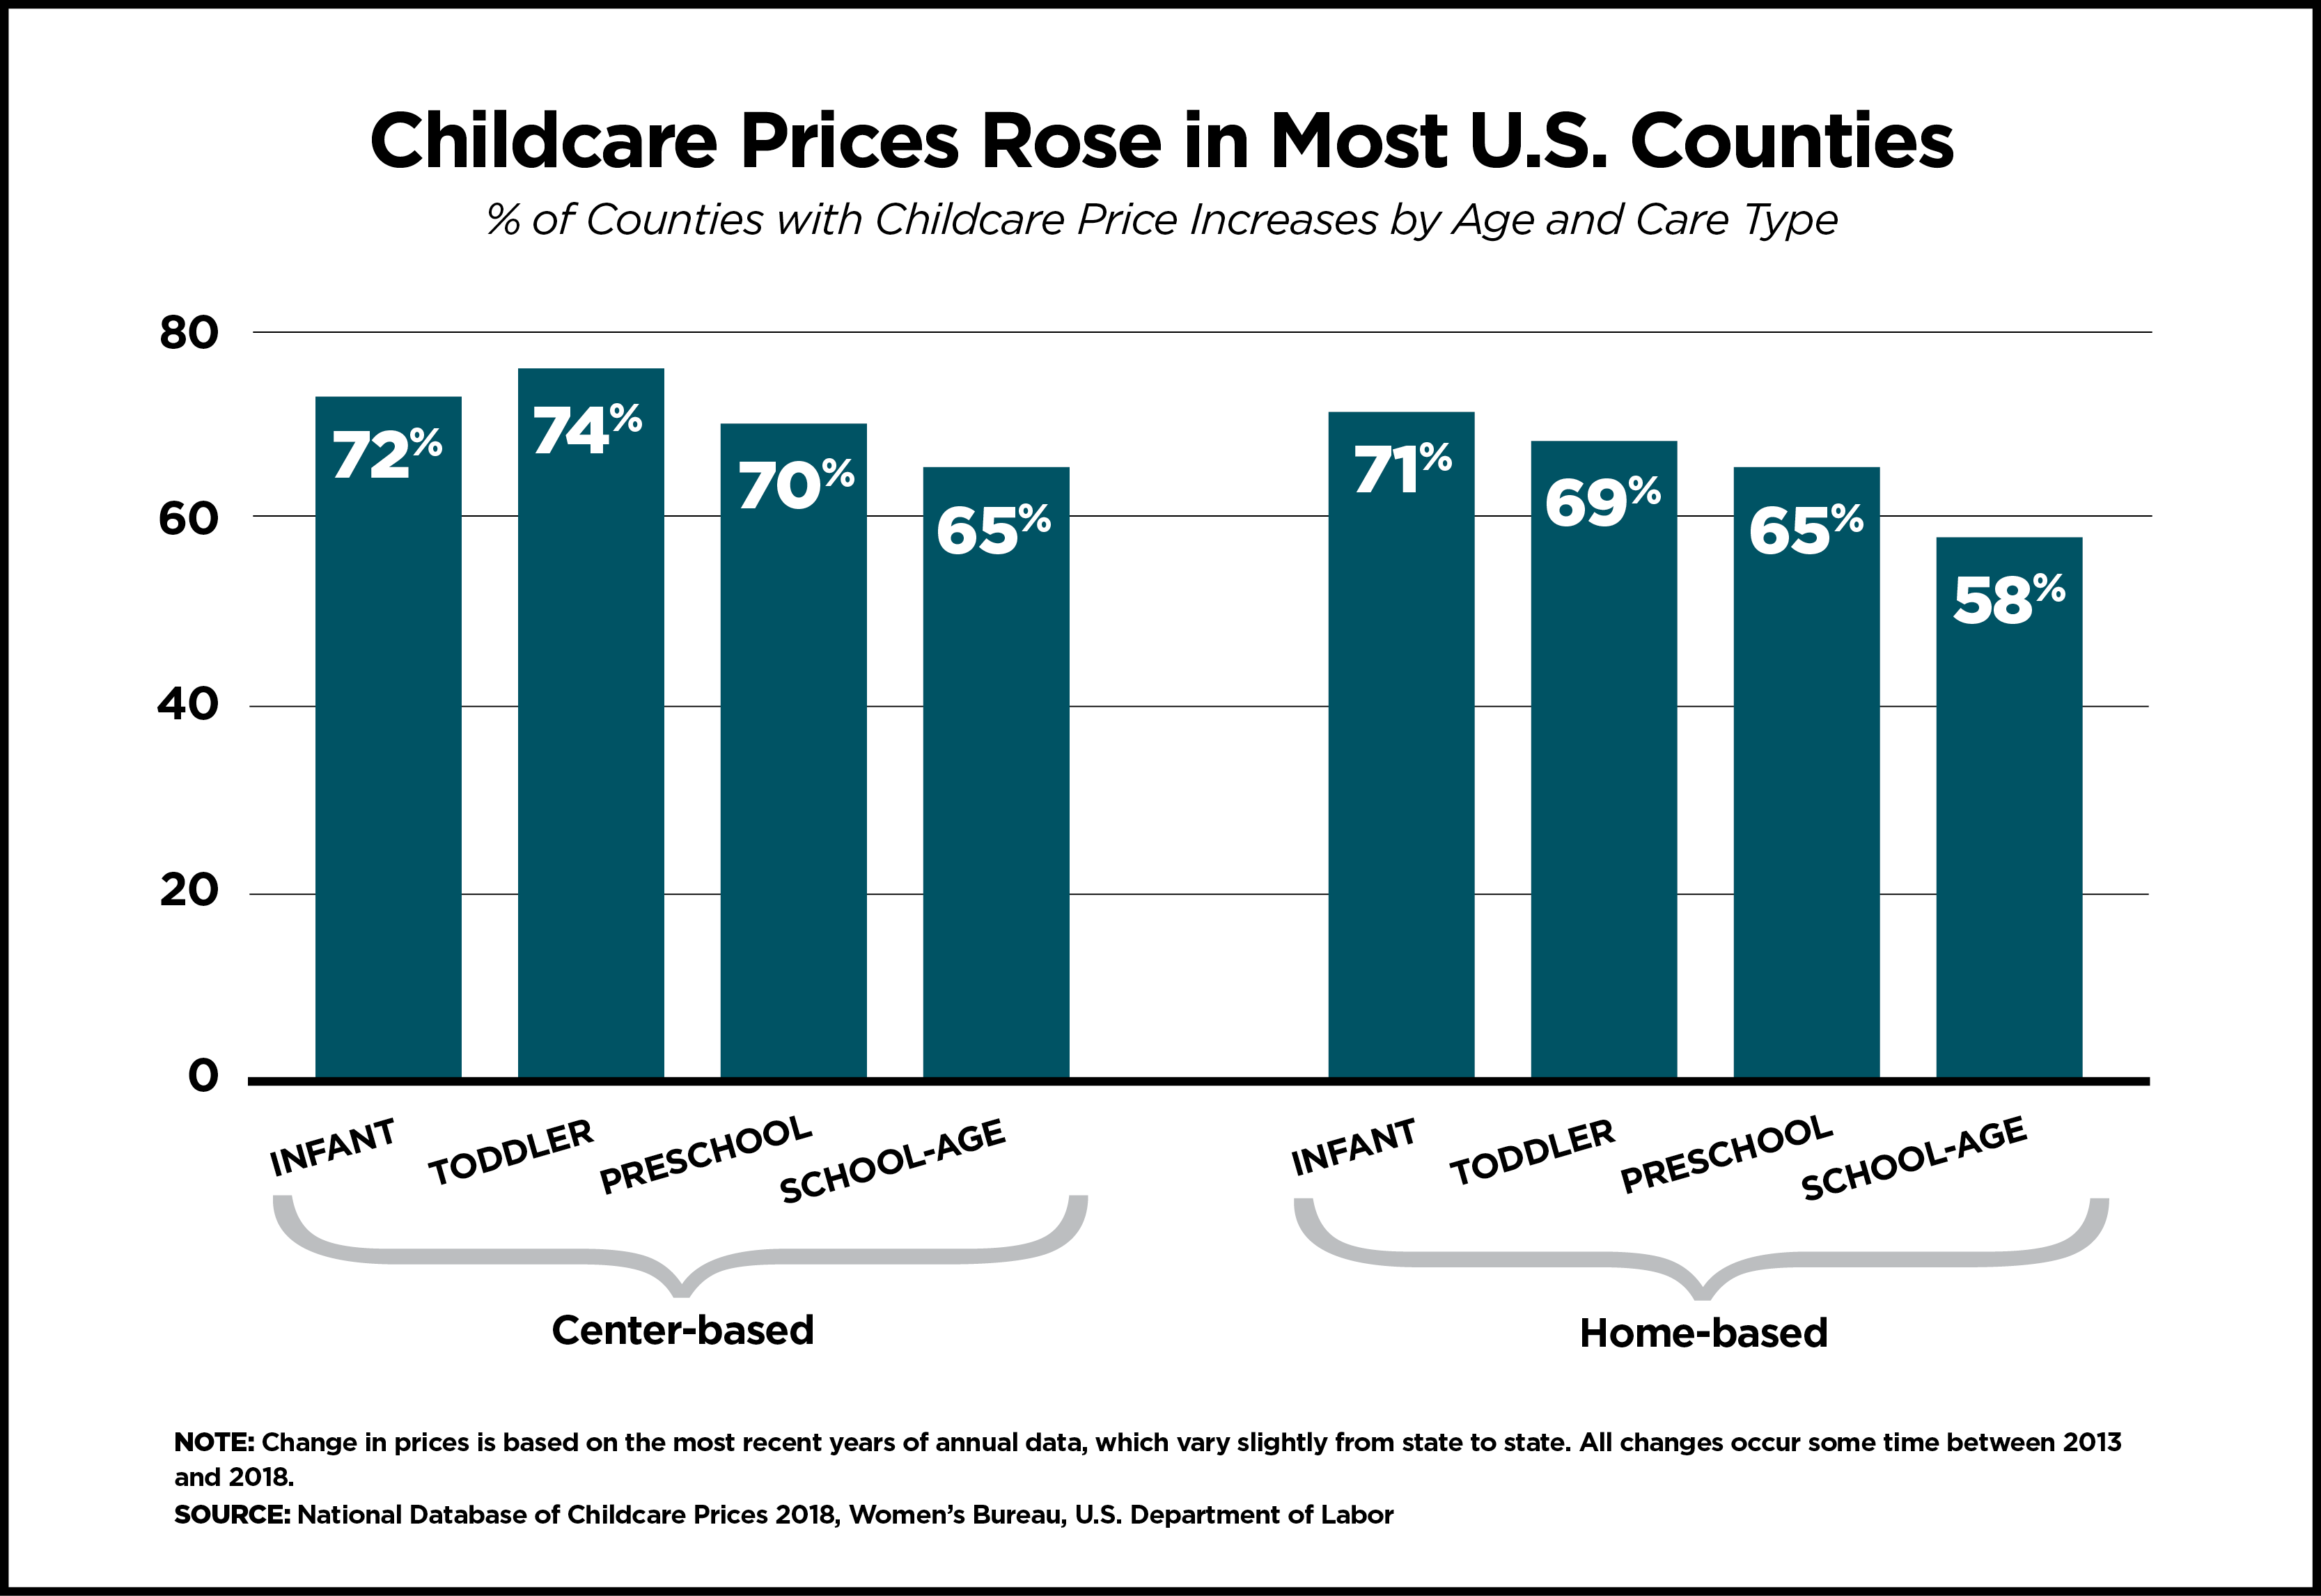
We performed an analysis of how pricing changed between 2013 and 2018 by age of child and type of care (i.e., center-based care or home-based care). In all cases, the majority of counties with data show increases in childcare prices during those years. Center-based toddler care prices increased across the largest share of counties: Fully three-fourths (76%) of counties experienced price increases for this type of care, which in 2018 cost $7,454 on average per child ($9,206 in 2024 dollars). Home-based care for school-aged children was the least likely to show an increase – but it was still the case that the majority of counties (58%) did experience price rises for this type of care. On average, the yearly price for home-based school-aged care in 2018 was $5,253 per child ($6,488 in 2024 dollars).
Counties with large Hispanic populations were most likely to see price increases
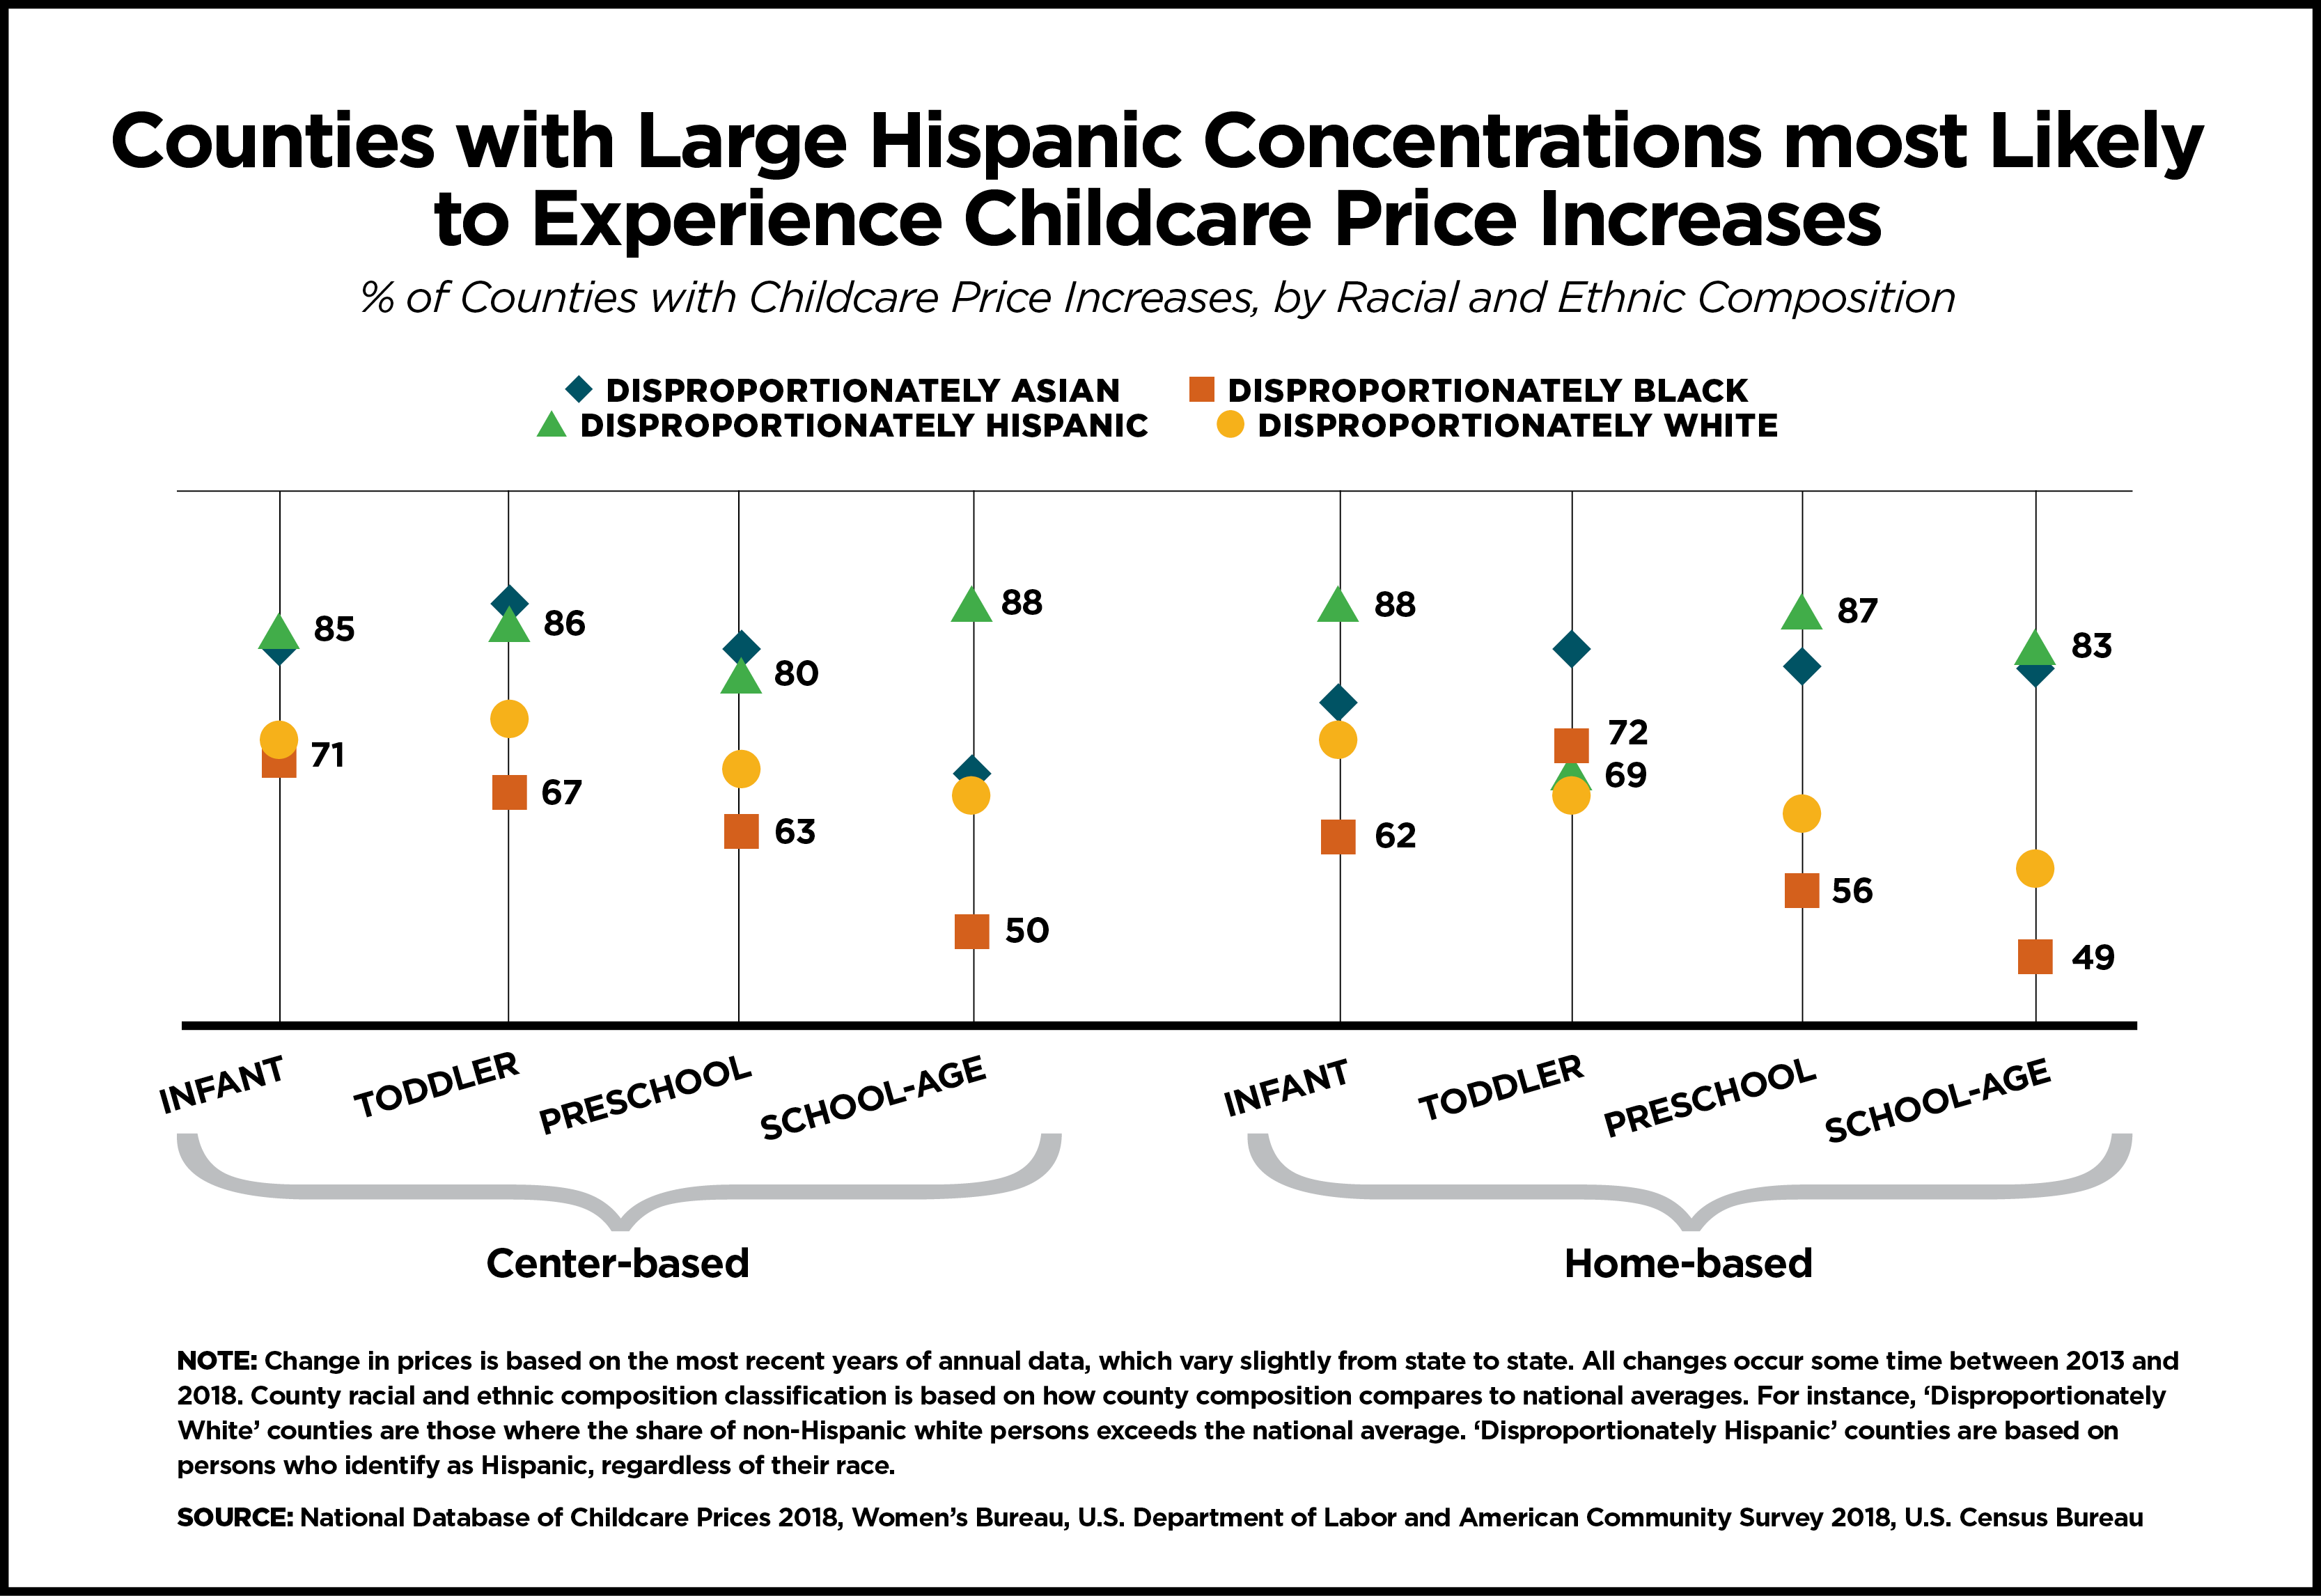
In general, counties with a large Hispanic population were most likely to see price increases. 80% or more of counties where the share of Hispanic residents was above the national average of 18.3% experienced annual price increases across the board, with one exception (home-based preschool care). Conversely, counties with a large Black population (i.e. Black residents comprised 12.7% or more of the county population) were less likely to experience childcare price increases – although more than half of these counties (59%) still experienced increases.
Overall, our analysis of the NDCP, the only federal dataset that provides county-level data on childcare pricing nationally, contributes additional evidence that childcare prices were untenable for families in 2018 – and that trend likely continues today.
TO FURTHER EXPLORE HOW CHILD CARE PRICES HAVE CHANGED, CLICK HERE.
Methodological note: This analysis is based upon 37 states. There was not sufficient data for Colorado, the District of Columbia, Georgia, Iowa, Illinois, Indiana, Missouri, Montana, Nebraska, New Hampshire, New Mexico, New York and Rhode Island. Changes in prices are based on the most recent years of annual data, which vary slightly from state to state. All changes occur sometime between 2013 and 2018. County racial and ethnic composition classification is based on how county composition compares to the national averages in 2018, according to the American Community Survey 2018 1-Year Estimates. For instance, ‘Disproportionately Black’ counties are those where the share of the population that is Black exceeds the national average of 12.7%; ‘Disproportionately Hispanic’ counties are those where the Hispanic population exceeds the national average of 18.3%; ‘Disproportionately Asian’ counties are those where the Asian population exceeds the national average of 5.6% and ‘Disproportionately white’ counties are those where the non-Hispanic white population exceeds the national average of 72.2%. ‘Disproportionately Hispanic’ counties are based on persons who identify as Hispanic, regardless of their race.
Georgia Poyatzis is an Economist at the Women’s Bureau. Gretchen Livingston is the Branch Chief of Quantitative Research at the Women’s Bureau.
Holloway.Loryn…
Mon, 09/30/2024 – 09:23